Live Application — Production Build
A single portable HTML file that aggregates 16 live data endpoints across 9 APIs — traffic, transit, ferries, weather, fire dispatch, seismic, and flight delays — into a unified situational awareness interface for the Seattle metro area. No login. No backend. No build step. Copy it anywhere with an internet connection and it runs.
A 60-second walkthrough of GOATvision Seattle pulling live data across 16 endpoints — traffic, ferries, weather, transit, fire dispatch, and more. Narrated. No cuts.
GOATvision Seattle was built to answer a simple question: what is actually happening in Seattle right now? Not fragmented across six browser tabs, not behind a paywall, not requiring an account. One page. All of it.
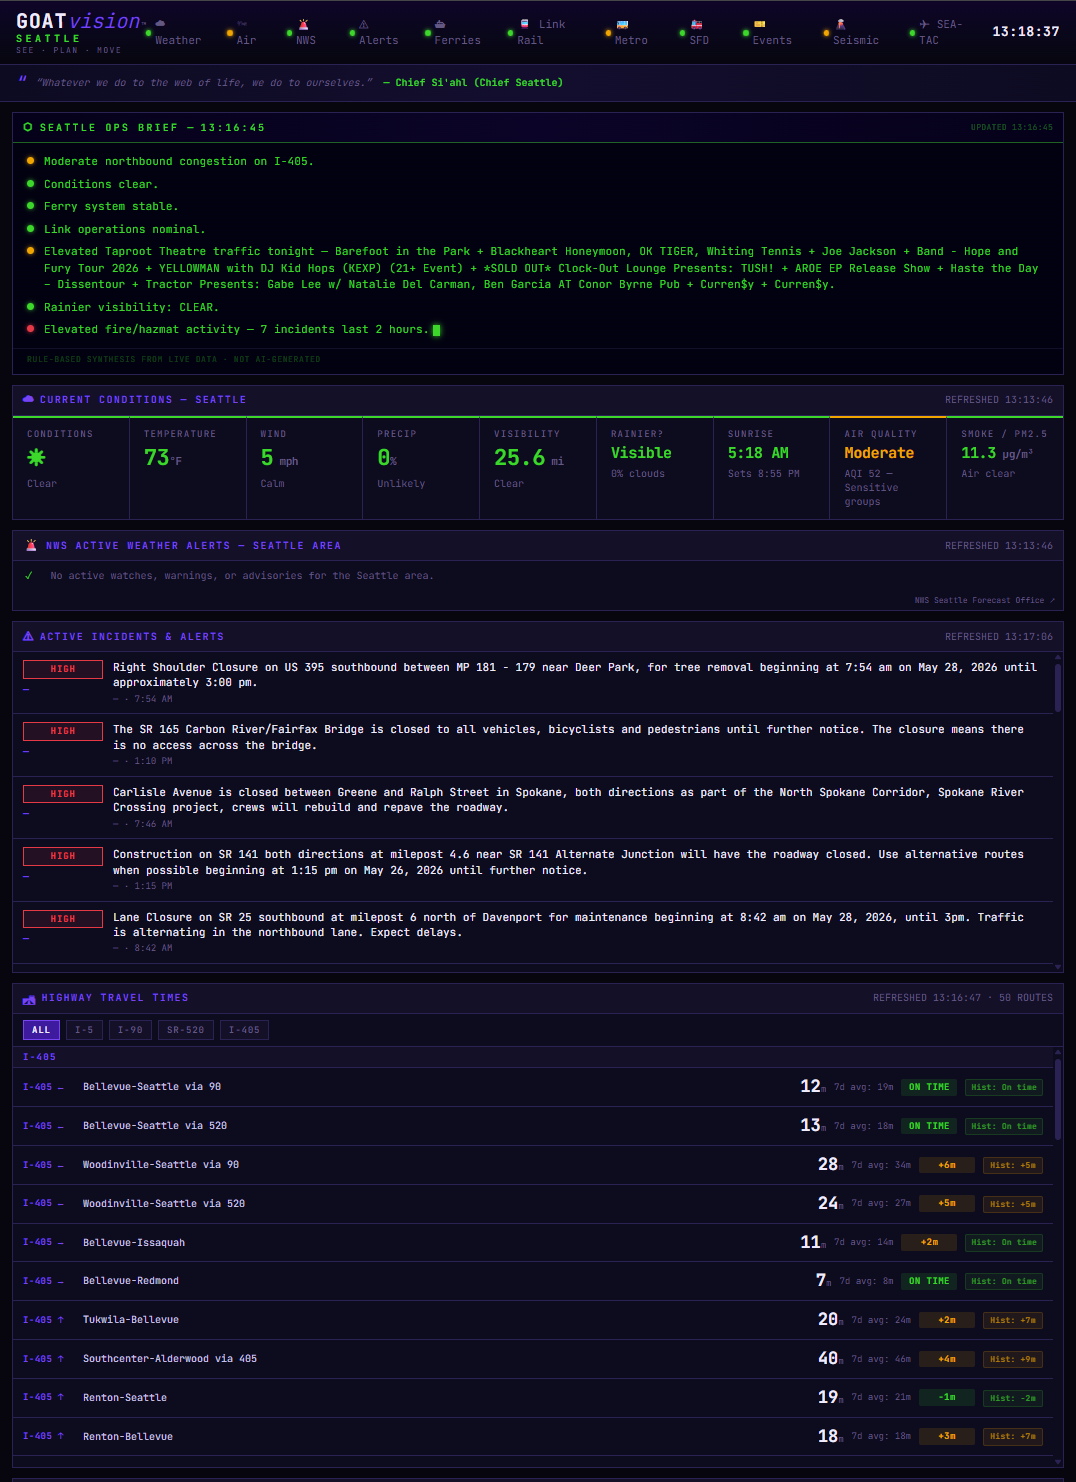
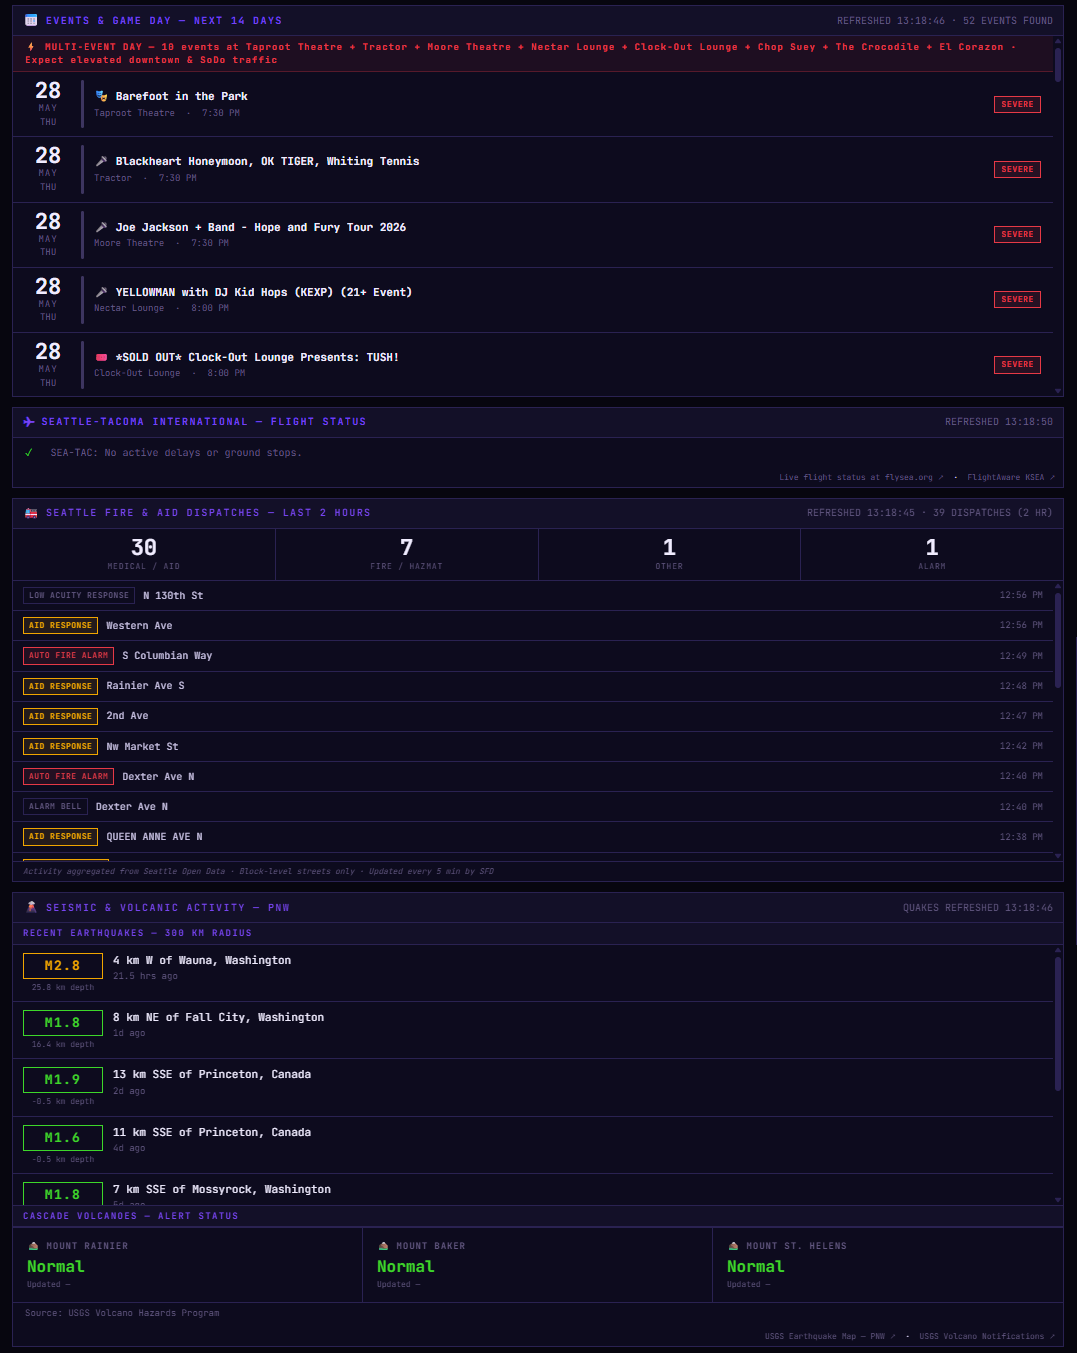
The dashboard pulls live highway travel times from WSDOT, real-time Link Light Rail arrivals from OneBusAway, Washington State Ferry vessel positions via GPS tracking, current weather and air quality from Open-Meteo, Seattle Fire Department dispatch records from the last two hours, M1.5+ earthquakes and Cascade volcano alert levels from USGS, SEA-TAC airport delay status from FAA, and active game and event schedules from ESPN and Ticketmaster — 16 individual endpoint calls across 9 distinct providers. Every panel updates on its own refresh cycle — ferry positions every 2 minutes, weather every 5, events every hour.
At the top of the page, the Seattle Ops Brief synthesizes everything into a plain-English situational summary — worst traffic corridor, current weather conditions, ferry gap status, transit availability, active NWS alerts, and today's events — no AI, purely conditional logic.
Every source below is fetched client-side, on its own refresh cycle, with graceful error states when data is unavailable.
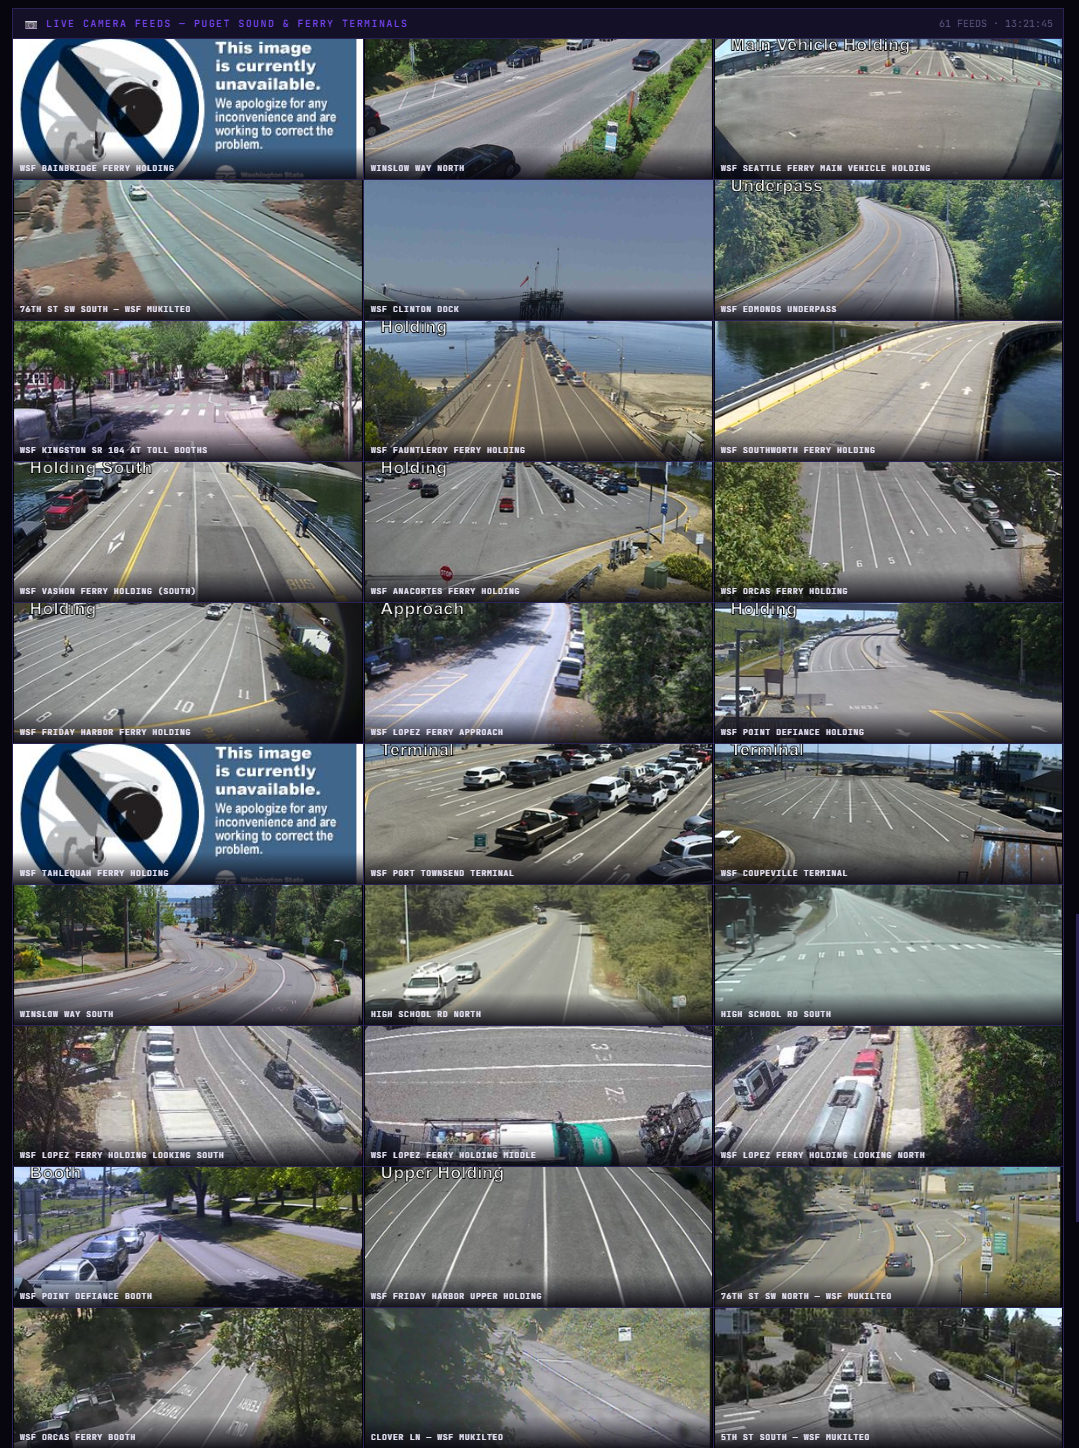
These are live screenshots from the production build — not mockups, not staged. The data you see was live at the time of capture.
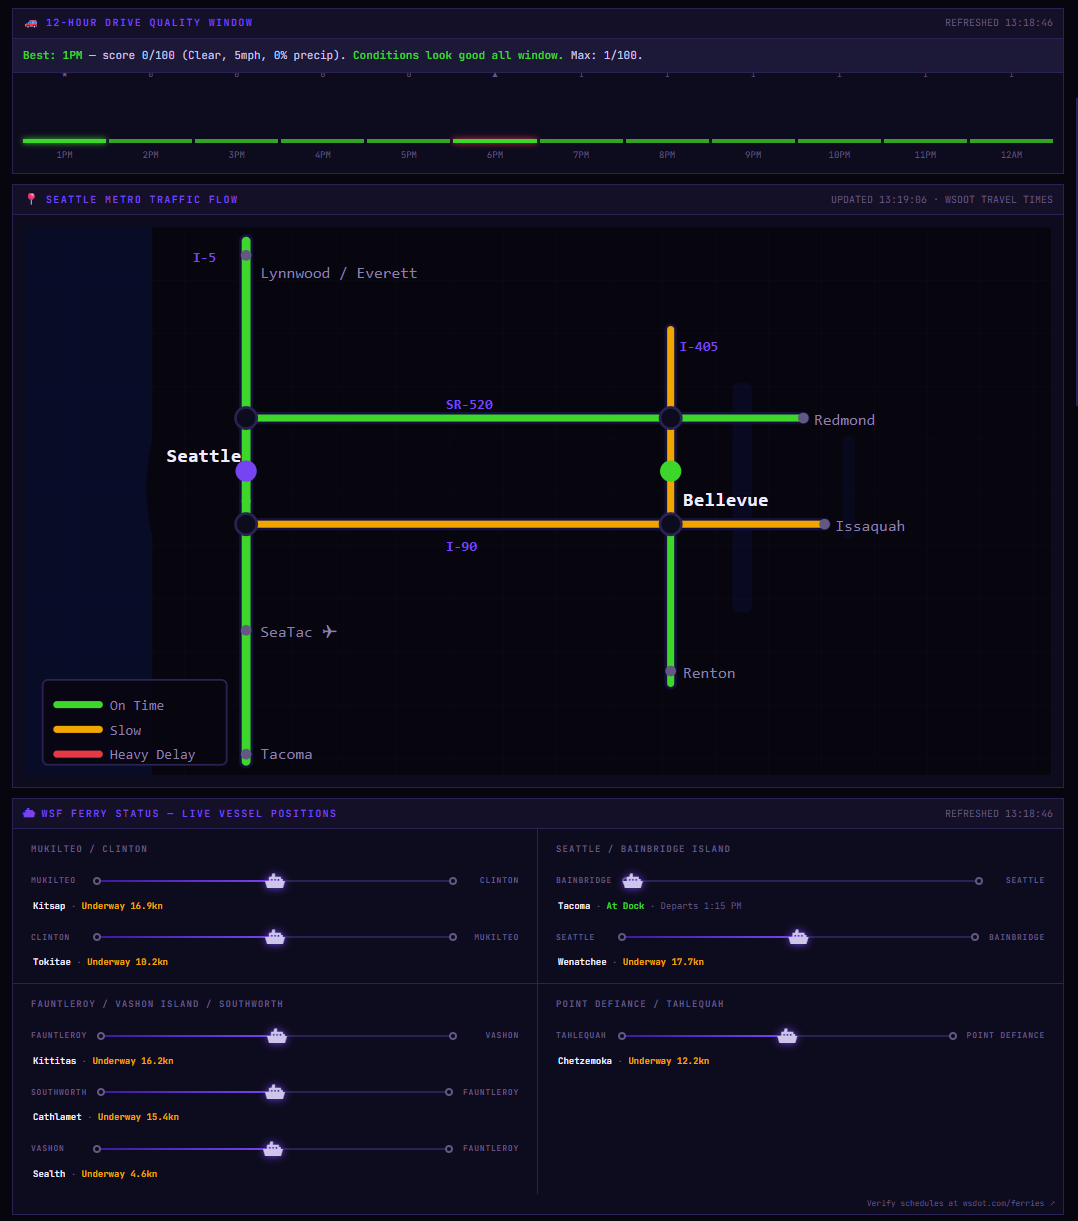
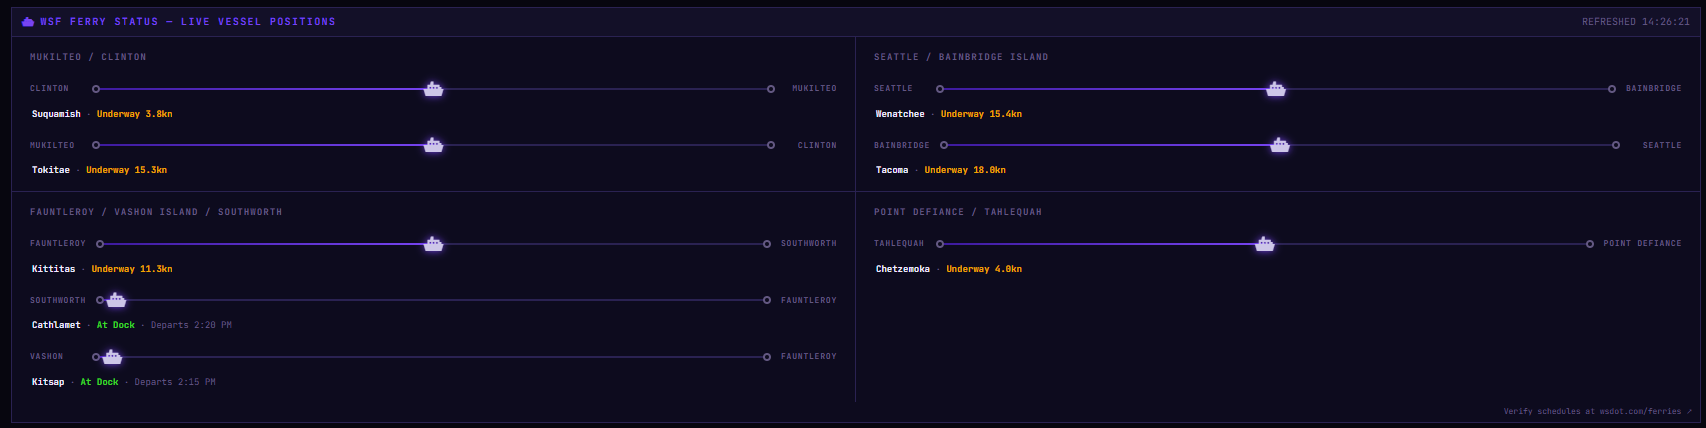
Of all 16 live data panels in GOATvision Seattle, the WSF Ferry tracker is the one that consistently stops people. It pulls live GPS coordinates from the Washington State Ferries vessel API every two minutes and calculates each vessel's real-time progress across its route using the Haversine formula — measuring the great-circle distance between the vessel's current position and both terminal endpoints. The result is an animated progress bar that shows exactly where each ferry is on the water, right now.
The entire application lives inside a single HTML file — ~3,800 lines of HTML, CSS, and vanilla JavaScript with no npm packages, no build pipeline, and no backend server. Every data fetch happens client-side. Copy the file to any machine with an internet connection and the dashboard runs.
Hist: badge in the travel times panel.CITY_CONFIG. A new city can be stood up by changing lat/lon, team IDs, transit stop IDs, and API keys — the panel logic stays intact.The city-specific logic is isolated in a single config object. Swapping it out is the majority of the work needed to deploy a new city.
GOATvision Seattle is live at goatvisionseattle.vercel.app — no account, no login, no friction. Open it and the dashboard starts pulling data immediately.